Project Development Process

Early Planning - GEOM68 Project Planning

A general workflow was conceived during the project's planning phase. The plan would be to achieve objectives and produce deliverables in a logical sequence. Creating a file geodatabase would be the first item to establish a centralized data hub from which all data can be processed and published. From there, the workflows to develop the Interactive Web-Map and Offline Viewing Solution can be established concurrently to maximize time/scheduling.

Relevant Big Image

Data Acquisition and File Geodatabase

This section showcases the development of the file geodatabase and its models (toolboxes) during this project.

Workflow Diagram

The diagram here is the first instantiation of this project that collects data from the client and manipulates it accordingly to plan; this follows a linear workflow with a few loop-backs for either improving or editing particular objectives and follows with the Interactive Web Map in the latter.

File Geodatabase Workflow

Elements of the Process

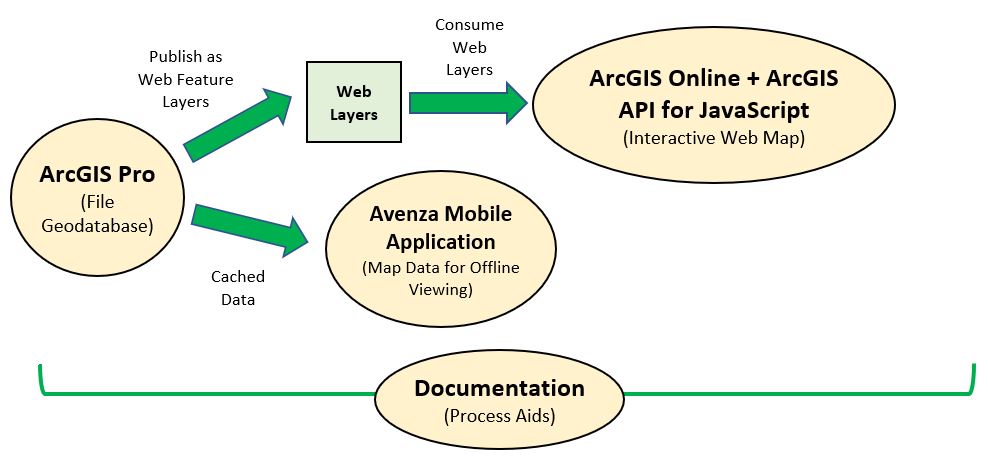
The following descriptions are a brief overview of what was utilized in this deliverable: File Geodatabase and Spatial Analysis and Data Preprocessing.
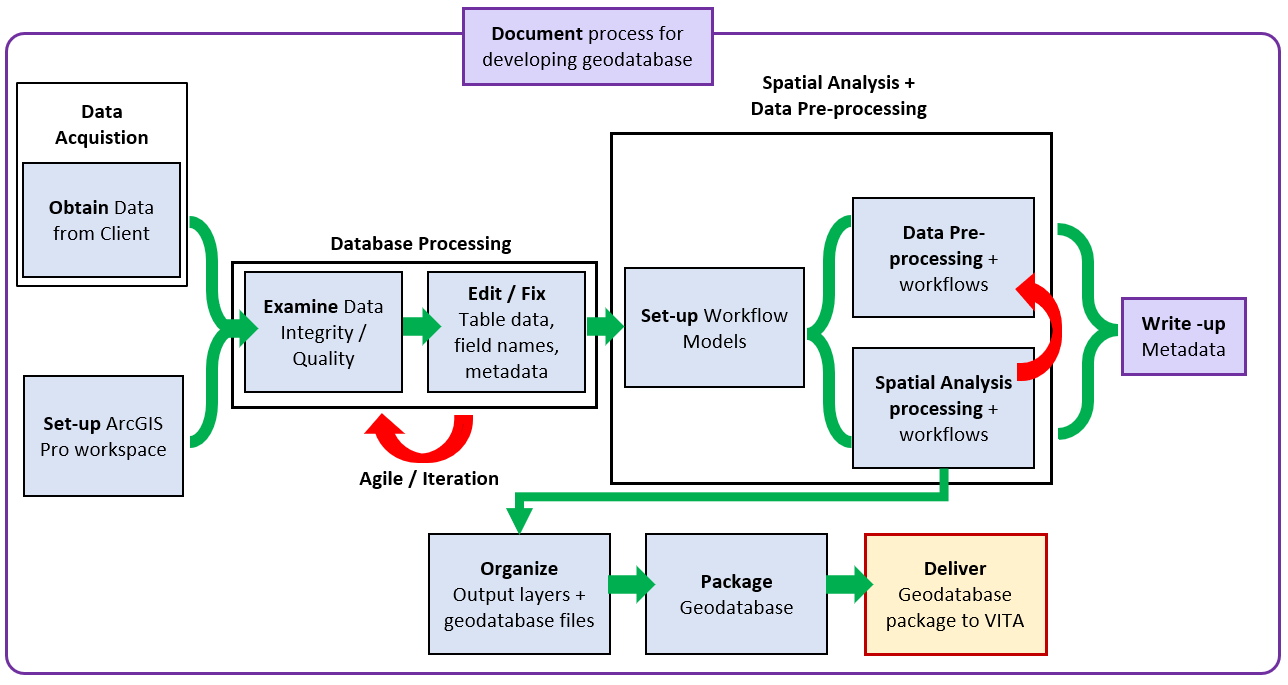
File Geodatabase

Had finished the File Geodatabase with Esri's ArcGIS Pro software. Data from the client was collected and imported to an ArcGIS Pro Project and exported to the default geodatabase. Afterwards, performing Quality Assurance/Quality Control (QA/QC) on the data to ensure it was as user-friendly and readable as possible, using the clients' requests. This includes modifying the data's attribute tables and their columns, rows, values, and metadata.

Spatial Analysis and Data Preprocessing

The Data Preprocessing portion involved taking what was previously mentioned in the first paragraph and editing the data according to Vancouver Island Trail Association's (VITA) preferences. The data preprocessing portion involved two parts. The first part was projecting all data to the local province's projection and datum, i.e. NAD 1983 BC Environment Albers. The second part was clipping all the data to the extent of Vancouver Island.

The Spatial Analysis portion involved taking the projected and clipped data and doing some analysis on the data. Firstly, merging was done to the geology data as they were split into two for the whole island; this was done to reduce the repetition of data and make it more readable. Lastly, generalizing of contours and streams was done by removing increments and lengths less than a threshold our client had specified.

Interactive Web Map

The web map would involve developing the necessary web infrastructure in order to create a standalone web map application.

Workflow Chart

Development of the interactive web-map would follow directly after the geodatabase which would provide the processed data layers. It largely followed a linear sequence of events depicted below

Relevant Big Image

Elements of the Process

The process illustrated in the flowchart above uses Web technologies, Cartographic Visualization Principles and Web Programming to bring the interactive web map to life.

Web Technologies

ArcGIS Online (AGOL) was used as the primary Software-as-a-Service Product and was used as the cloud infrastructure to manage and consume the data layers into a 3-dimensional web scene. ArcGIS Platform would be used to bring Esri mapping tools, data and location services into the web map as interactivity features to enhance user experience and embed the web scene onto a standalone Web Map application (see programming below). GitHub is used as the hosting platform for this web map application.

Programming

Web coding would use ArcGIS API for JavaScript to enable interactivity features and embed the web scene as a standalone web map application onto an HTML webpage. HTML + CSS coding was used for additional formatting that would aid in bolstering the cartographic visualization of the user interface.

Solution for Offline Viewing

The offline viewing solution involves creating downloadable files that are accessed on an offline-capable navigation app such as Avenza Maps: Offline Mapping on a mobile device (smartphone).

Workflow Diagram

Development of the Offline Viewing resources would follow directly after the geodatabase, with reference to the interactive web map to keep consistency with the symbologies and stylings between the two parts. It is a mostly linear process, with a small section of iterative steps as a part of the whole process. It involves finding the optimal methods of creating files from the geodatabase to the offline navigation maps operating on the Avenza Maps: Offline Mapping mobile app.

Offline Viewing Workflow

Elements of the Process

The process illustrated in the flowchart above makes use of Data Acquisition and Preprocessing and Cartographic Visualization Principles to make offline viewing possible.

Data Acquisition and Preprocessing

ArcGIS Pro is used to group and convert layers into KMZ format using the "Layer to KML" tool from the ArcGIS Pro Toolbox after symbolizing them correctly. These files carry different projections (WGS1984) from the geodatabase. Thus, check that there is no incompatibility with PDF base maps that have a different projection system.

Cartographic Visualization Principles

Produced the PDF base maps with the "Export Layout" function in ArcGIS Pro. Layers are styled and symbolized the same way as the interactive web map for consistency before conversion.